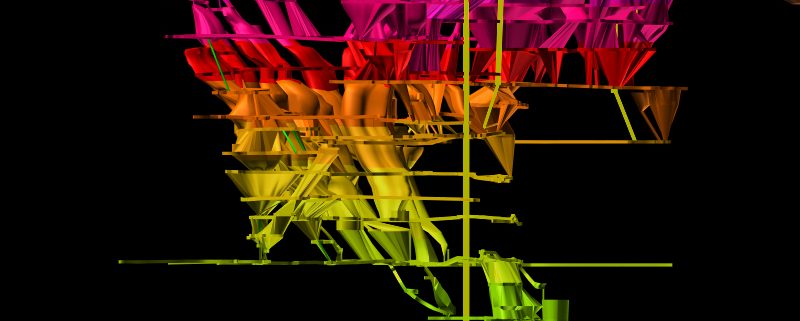
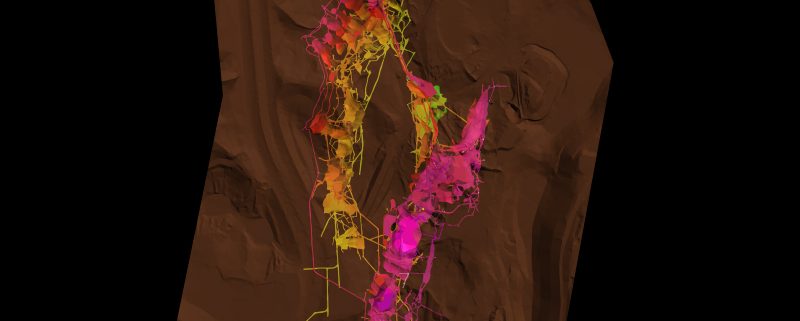
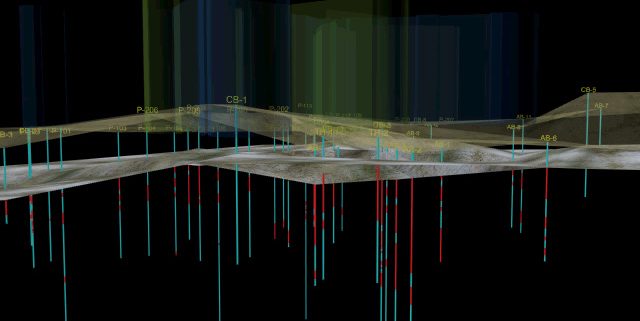
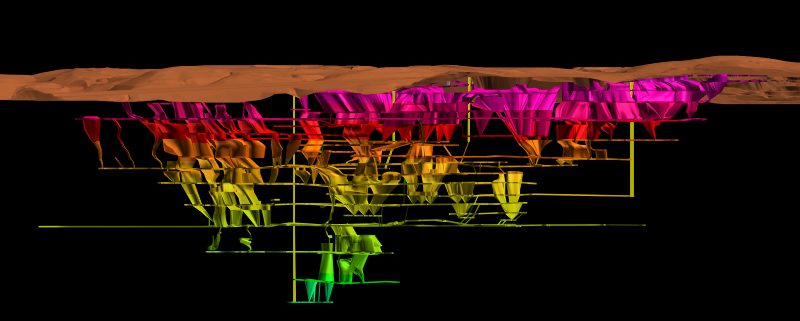
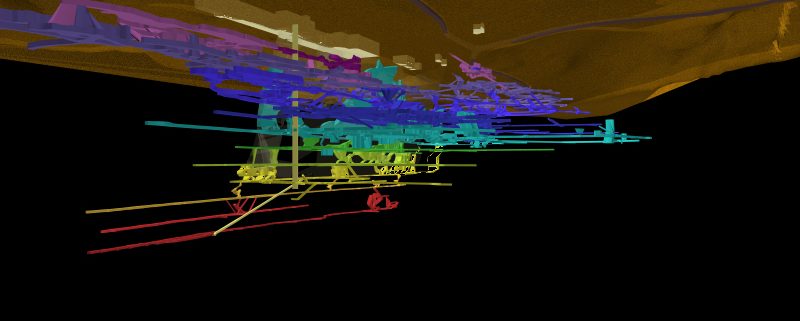
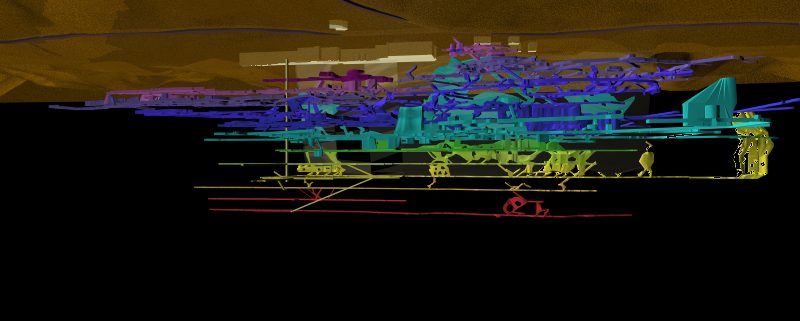
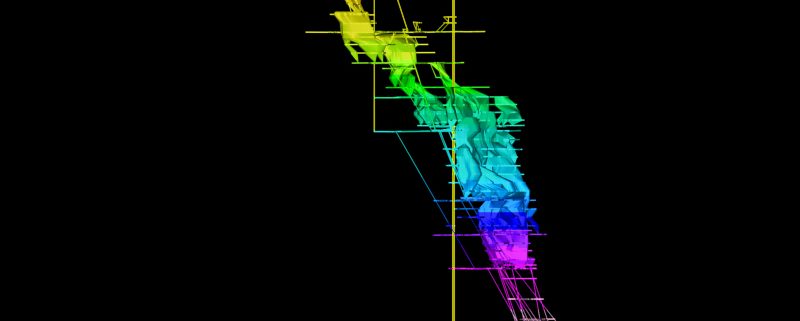
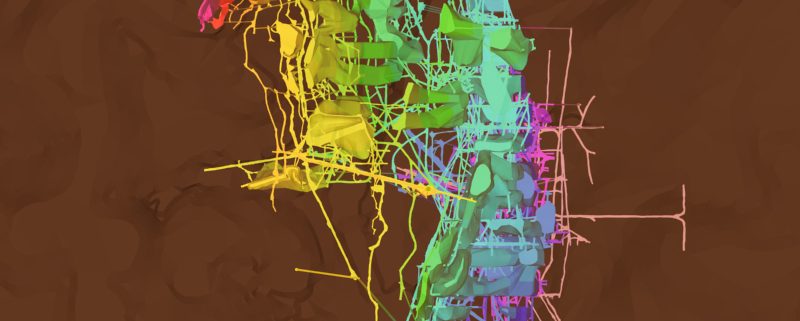
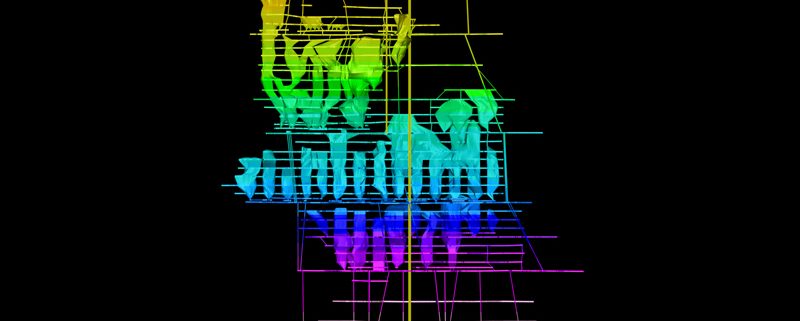
SubTerra, Inc.’s Design Visualization services use the latest 3D modeling technology as an engineering design tool for 3D spatial data management, 3D geological modeling and design visualizations. Design tools bridge the gap between exploration and construction by bringing project data together from a variety of sources into an open, multi-user database that is used in a variety of engineering tasks. The combination of 3D geologic modeling and design visualization is a powerful tool in preparing engineering design documents and specifications, analyzing 3D data, and communicating design concepts to both owners and the public. Our services for 3D geological modeling and design visualization include:
Data Validation
Data Validation, Analysis and Compositing: Raw data is only as useful as what you can do with it. Data manipulation and analysis is a key feature of our database system. It is possible to filter project data using selection criteria or restructure the project database.
Before we begin to analyze project information, we verify it with our validation tools to determine the integrity of the data. Then, we can analyze the data in a variety of ways. With a few clicks of the mouse, we can turn out contour maps and raster images on any plane to identify sample distributions or anomalous zones.
Database Management
- Excavation method selection, including risk-based modeling of excavation system performance
- Review of contractor proposals
- Blast design, monitoring and optimization
- Design of ground support and monitoring systems including design with shotcrete, geotechnical instrumentation for support performance verification
- Seepage estimation and control
- Subsidence evaluation and monitoring
- Ventilation system design and surveys
- Tunnel refurbishment/water proofing design and specification
- Geotechnical Data Reports (GDR)
- Geotechnical Baseline Reports (GBR)
- Project planning, cost and schedule estimates, Design Drawings, Specification and Bid Document preparation.
Geo-Statistics
Geostatistics to provide geological characterization and a geotechnical framework for engineering design, risk assessment, and preparation of factual and interpretive reports. We have options for analyzing project data using histograms, scattergrams, classical statistics, log and probability graphs and geostatistics. We can conduct a regression analysis or fit models to semi-variograms as needed. We can then prepare presentation and reports by cutting and pasting graphs into any Windows document, so we can easily present project information accurately and professionally.
Geologic Modeling & Visualization
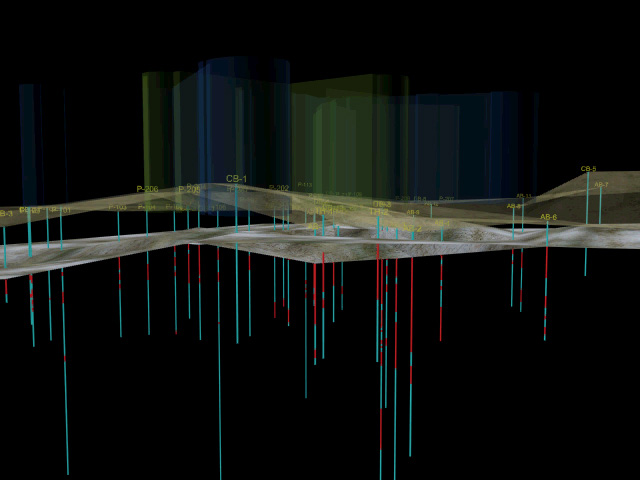
3D Geologic Modeling and Visualization . We don’t limit ourselves to 2D views of project 3D data. Our design tools are specifically designed for modeling complex geologic situations. We have specialized tools for constructing solids and surfaces to represent geological zones, faults, topography and seam boundaries. We can take 2D geological interpretations to the next level by building 3D solid and surface models using tie lines to connect sections. Or, we can create 3D fault surfaces directly from drillhole intercepts and use the results to determine displacement sequences. By comparing our 3D outputs with geological and structural theories, we can measure the integrity of the projections. We can then control and refine the shape of the 3D model to see how the solids and surfaces fit with drillholes on planes along other orientations.
3D Design Engineering
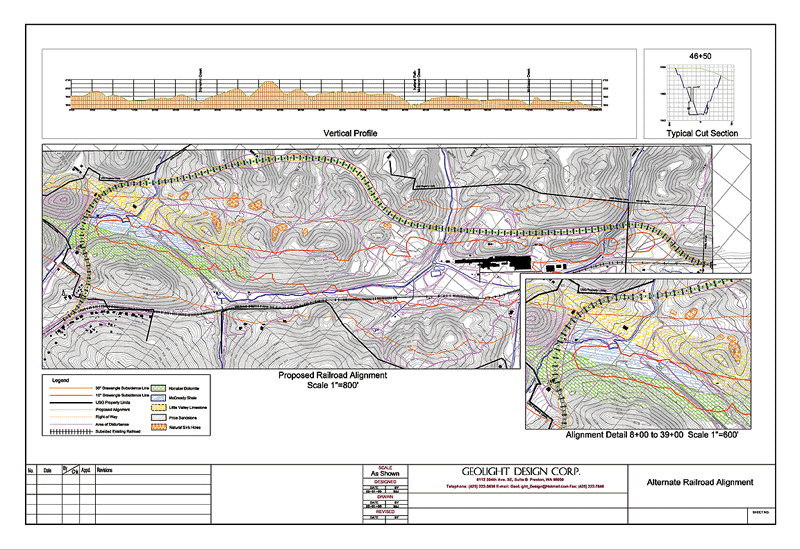
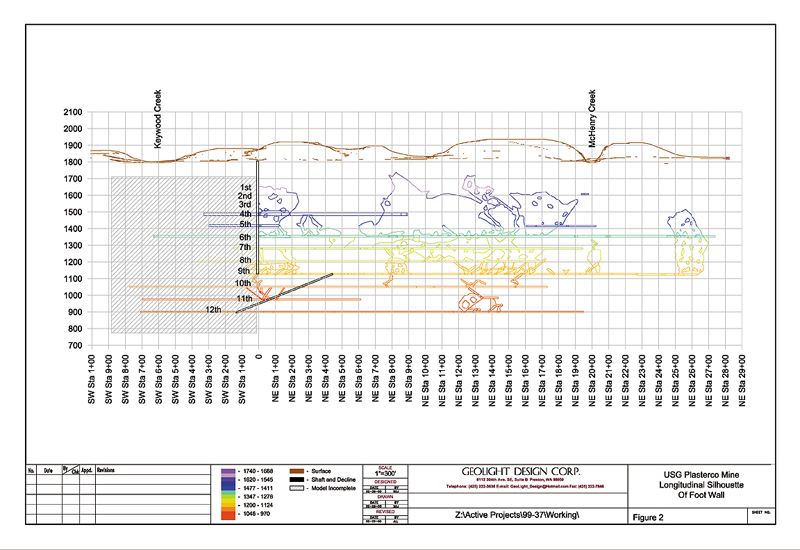
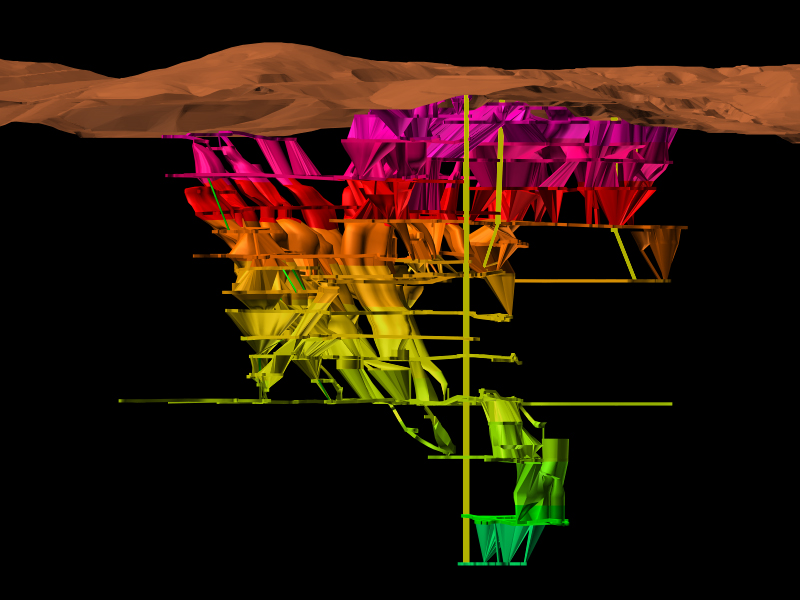
3D Design Engineering. We use our state of the art design tools to plan civil facilities such as roads, storm water diversion ponds, mines, and underground mine and tunnel layouts. For underground mines and tunnels, we have polyline tools that allow us to lay out developments, shafts, declines, raises and stopes, then evaluate them using 3D geological data to estimate mining reserves and estimate costs. For civil structures built above ground, we can plan detailed bench, crest, and toe layouts as well as road layouts. Our surface modeling tools let us incorporate your projects changing topography into your project plans over various time spans.
Design Visualization
3D Design Visualization to provide you with perspective, the model can be view in a number of ways to aid visualization of the project site. We can view your 3D information from any angle by changing the view orientation by rotating, panning and zooming. The surfaces can be made transparent to let you look inside to see drillholes and other data visually represented. And the smoothing capability gives the solids and surfaces a more realistic appearance.
SubTerra, Inc. brings over twenty five (25) years of experience on over 100 completed Tunnel and Microtunnel projects. This experience includes Owner and Contractor Design, Design Review, Construction Management, Claims and Claims Management and Expert Support in Litigation. Projects include Conventional Excavation (drill-and-blast), NATM/SEM, TBM, EPBM, MTBM and a wide range of Pipe Jacking with tunnels as short as 40-ft and as long as 9-miles.
We specialize in Complex Designs providing simple solutions for Complex Projects using a full range of Design Tools and 3-D Modelling to demonstrate Complex Projects in advance of Construction.
Dynamic 3D Modeling for Blueprints & Drawings
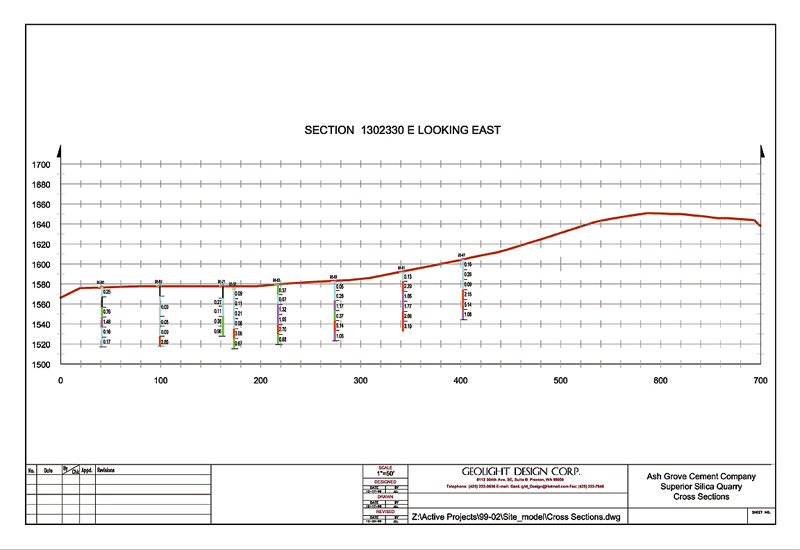
3D Models Produce 2D-Design Drawings. Once a projects 3D model is constructed, much of our work involves projecting data on to planes or combining it with topographic data on surfaces. These representations of 3D data are commonly created from the project database. For maximum efficiency, we utilize our 2D plane-processing options. We are able to provide information in a variety of ways, including:
- variable symbol maps;
- surface structure maps;
- sections through drillholes and test pits;
- pattern or color filled drillhole and traverse traces;
- stacked annotations along drillhole and traverse traces using values or graphs;
- data interpolation using inverse distance or Laplace gridding;• creation of cell and contour plots and “hot/cold” images.
Data Graphics & Technical Representation
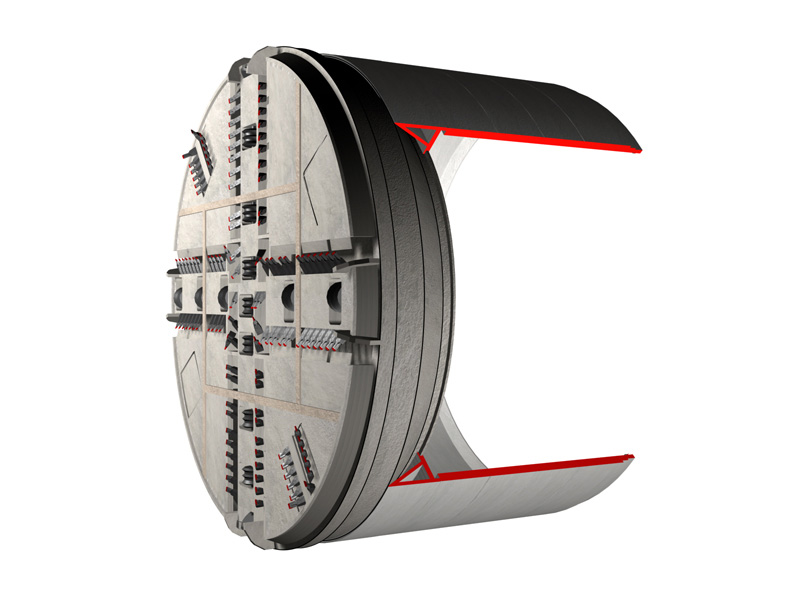
3D Graphics and Technical Presentations . The ever-increasing capabilities of CAD software products have brought new clarity to the civil engineering profession, traditional 2D design drawings have been increasingly replaced by colorful 3D renderings, panoramic imagery, multi-media presentations and animated videos. We use our 3D geological models and design drawings as a basis for preparing technical presentations and products including:
Enhanced Photographs – this is simply a process of enhancing a photograph by “cutting” an image from one scanned photograph and “pasting” on another in order to create an image of a proposed project or facility.
Photo/Montage – provides the ability to produce simulated project visualizations and involves taking digital photographs of selected areas then overlaying the proposed 3D design onto the photo in geometrically correct position. We can produce before and after photos using this process as well as transfer these images to videotape for easy presentation to the public.
Immersive Panoramic Photos – Using Apple’s QuickTime VR (QTVR), we can create immersive images that are produced from panoramic QTVR imagery. This immersive technology offers the view the ability to interactively direct their viewing experience in 3D space. The view controls the experience, either looking up, down and any direction and also zooming in and out within a panoramic 360-degree space. QuickTime VR’s use on the web is increasing at an exponential rate. The perfect vehicle to showcase your facilities, projects or products. The new QuickTime 3 allows QTVR panoramas to incorporate sound and video tracts for an even richer environmental experience.
Video/Overlay – an extension of the photo/montage concept by including a series of moving background images (Video or QuickTime format) which then are transformed to show proposed new facilities.
3D Animations – Solids and surfaces can be transformed and enhanced using this powerful, flexible method to illustrate many views of a proposed project. It differs from the other methods in that it only involves computer simulation and does not use actual photographs or video of the existing area. This method could be used to simulate a car driving by a proposed site (Video or QuickTime format) to illustrate the visual impacts of a proposed facility, before it is built, or simulating a helicopter fly-over. We can also include data in from the database such as drillholes or trenches to show a fly-through the data, below or above ground.
